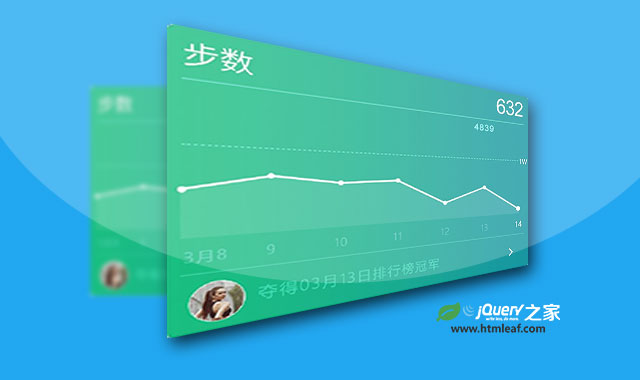
wcMotionChart是一款基于HTML5 Canvas的微信运动折线图jQuery插件。这款插件是网友LipsonChan在工作过程中编写的。通过该插件你可以制作出某段时间内的动态折线图信息,非常有用。
使用方法
使用该微信运动折线图插件需要在页面中引入jquery和wc-motion-chart.js文件
<script type="text/javascript" src="js/jquery.min.js"></script>
<script type="text/javascript" src="js/wc-motion-chart.js"></script>
HTML结构
该微信运动折线图的基本HTML结构是一个Canvas元素,为该元素设置宽度和高度。-webkit-tap-highlight-color属性只针对iOS设置。在iPhone或ipad中,当你点击一个链接或者通过Javascript定义的可点击元素的时候,它就会出现一个半透明的灰色背景。你可以通过-webkit-tap-highlight-color属性来修改这个颜色。这里将透明度设置为0,使该颜色不可见。
<div class="circle">
  <canvas id='wcMotion'
        style="width:912px; height:515px;
        margin: 0 26px;
        -webkit-tap-highlight-color: rgba(0,0,0,0);">
  </canvas>
</div>
初始化插件
在页面DOM元素加载完毕之后,你可以通过wcChart()方法来初始化该插件。
$('#wcMotion').wcChart();
你可以使用
setTimeout()方法来动态实时更新该折线图的数据。
window.setTimeout(function() {

  /* change height for rank */
  var height = $('#wcMotion').height() + 125;
  $('#wcMotion').height(height);

  /* load data */
  today.setDate(today.getDate() - 1);
  $('#wcMotion').wcChart({
    height: height, // width and height must be set if change
    day: today,
    data: [14759, 0, 2000, 8000, 3252, 5645, 6000, 34, 5454, 2],
    rankRef : {height: 125, avatar: avatarImg, title: "夺得03月13日排行榜冠军", url: "http://www.htmleaf.com"},
  });
}, 1000);
其中参数data中的数据可以通过ajax来获取,data数组中各个的数值代表每个折线点的值。
关于作者
该插件的作者是LipsonChan,它的联系方式有:
该微信运动折线图插件的github地址为:https://github.com/Grass-CLP/wcMotionChart

